JavaScript charts | Home
What is JS Charts?
JS Charts is a JavaScript based chart generator that requires little or no coding. With JS Charts drawing charts is a simple and easy task, since you only have to use client-side scripting (i.e. performed by your web browser). No additional plugins or server modules are required. Just include our scripts, prepare your chart data in XML, JSON or JavaScript Array and your chart is ready!
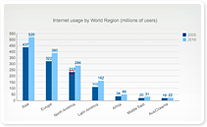
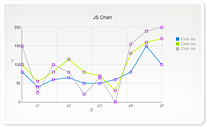
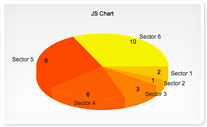
JS Charts lets you create charts in different templates like bar charts, pie charts or simple line graphs.
What's new?
- 3D pies and 3D bars NEW
- legends NEW
- multiple series in bar charts NEW
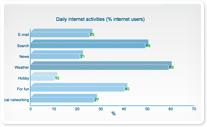
- horizontal bars charts NEW
- animated line/bar rendering NEW
- new customizing methods NEW
- Latest version: 3.04. Release date: Sept 25, 2012.
See the changelog
Features. Why should you use JS Charts?
- You don't have to write code
- It's easy to integrate
- It's customizable
- You can setup your charts online
- You can create the three most common types of charts: bar, pie and line
- It's compatible with most web browsers
- You don't need any server-side plugins/modules
- It's a 100% JavaScript component
- It's free (watermarked)


